
Projection: SNP Majority of 13, surprise gains for Lib Dems and UKIP
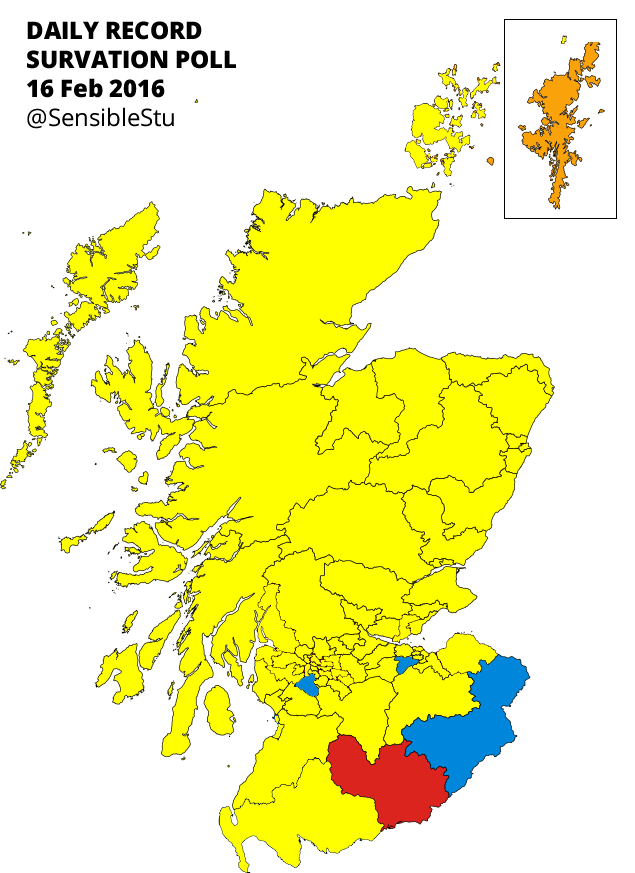
SNP: 71
Labour: 24
Conservative: 16
Lib Dem: 7
Green: 7
UKIP: 4
NB: if tables and charts don’t show, refresh page.
From now until the Scottish Parliament election in May, this blog will feature analysis of opinion polls and projections as to the result. These projections, I believe, are the most sophisticated presently in public circulation (see below for an explanation as to why).
The headline figures have been widely publicised and contain few surprises, save for the strong performance by UKIP in the regional vote share. The SNP leads Labour by 53% to 22% in constituency voting intention. The regional list voting intention see the SNP on 45%, Labour on 18%, the Conservatives on 15%, the Greens on 9%, with the Lib Dems and UKIP on 6% each.
However, some of the most surprising data is in the regional subsets. The Liberal Democrats show signs of recovery in key regions – Highlands and Islands, Lothians, and South of Scotland – formerly strong areas for the party. Perhaps unsurprisingly the Greens show their greatest growth in the Lothians (which once returned two Green MSPs), but the party also sees significant growth in Central Scotland (a seat in which eluded the Greens even at their 2003 high water mark). The Conservatives show modest growth, possibly suffering somewhat from the surprisingly strong numbers for UKIP in regions where the Tories would expect to poll more strongly.
The SNP’s seemingly interminable advance in the polls appears to have been halted in the South of Scotland, with Survation showing a decline in both parties’ shares, but no swing whatsoever from the SNP to Labour. Surprisingly, the Tories also show a sizeable drop in support in South of Scotland, possibly explained by the strong showing by UKIP in the Survation poll.
Projected into seats, it comes as little surprise that this represents a near clean-sweep for the SNP. Elaine Murray narrowly retains Dumfriesshire for Labour, and would be Labour’s sole constituency representative in May. On the basis of this poll, Labour isn’t even within 10% of the SNP in any other seat. The Conservatives, by contrast, win three constituencies, though not the three that they won in 2011. On the basis of the Survation data, the Tories lose both Ayr and Galloway and West Dumfries, but gain Eastwood and Edinburgh Pentlands. It’s worth noting that Eastwood will almost certainly be a three-way dogfight, and the Conservative candidate in Pentlands will not be the late and widely-liked David McLetchie. Liam McArthur loses Orkney to the SNP, but the Lib Dems are compensated with a seat on the Highlands and Islands list, meaning a return for erstwhile retired MSP Jamie Stone.
Overall regionally, Labour goes from seven to four in Glasgow and West of Scotland, and six to four in Central Scotland. Labour loses a further two seats in Mid Scotland and Fife, and one each in Highlands and Islands, Lothians, and North East Scotland. The Greens repeat their 2003 feat of two seats in Lothians, and a seat each in a further five regions. UKIP wins seats in four regions, including sneaking the last seat in Glasgow. If David Coburn is looking for the best place to run for the Scottish Parliament, at the moment that looks like either the Highlands and Islands or Mid Scotland and Fife.
A note on methodology
Over the past few months I have developed a complex system for translating opinion polls into seat projections. A system which, I believe, is far more accurate than the existing publicly available seat-forecasters. This is largely because my system uses the data subsets from opinion polls to forecast every seat, both constituency and regional, individually. This is, I believe, a far superior method for a number of reasons.
First, we can see in the polls and recent elections that the most stark shifts in voting intention have been in Central Scotland and Glasgow. In the above Survation poll the regional list swing from Labour to the SNP is in the order of 10%. By contrast, the regional list swing in the Lothians is 2%, and in South of Scotland is zero. Psephologists will always point out the hazards in placing too much faith in uniform national swings, but the variations this time are so stark as to render national figures alone far more questionable than in previous elections. On this basis, using the constituency voting intention regional data subsets provides a better picture than a uniform national swing.
Second, national figures severely distort projections with respect to smaller parties. 4% of the vote spread evenly across the eight regions will see a party return no MSPs whatsoever. However, 6% of the vote in half of the regions would see a party return four MSPs.
Third, the most crucial seat in every region, and also the most difficult to forecast, is the last one. In 2011, the SNP succeeded in poaching the final seat in five of the eight regions, in most cases by slim margins. Had four of those five seats gone the other way the SNP would have never won a parliamentary majority. By the time the final seat in a region has been allocated, the main parties’ votes could well have been divided by denominators as large as 11, presenting a uniquely welcoming environment for minor parties to secure a seat. While projecting those eight last seats is extremely difficult, the only way to do so with even a modicum of accuracy is to compute each region individually, rather than on a national basis.
I do not pretend that for a minute that the projections I will be sharing are a perfectly accurate forecast. In some instances, the polling subsets for particular regions (such as the Highlands and Islands) are so small that the likelihood of error is significant. This is a flaw in the underlying polling, and not the system I use for projecting seats. Furthermore, though regional variations are easy to detect and project, the polling data suggest that similarly stark variations exist amongst socio-economic groupings. While it would be possible to project socio-economic variations out of the polls onto individual seats, I am possessed of neither the raw data (broken down by constituency and region), nor the time, to make such projections. From this blog, regional variations are, for the time being, as good as it gets.

